
China Divorce Data 3D Infographic
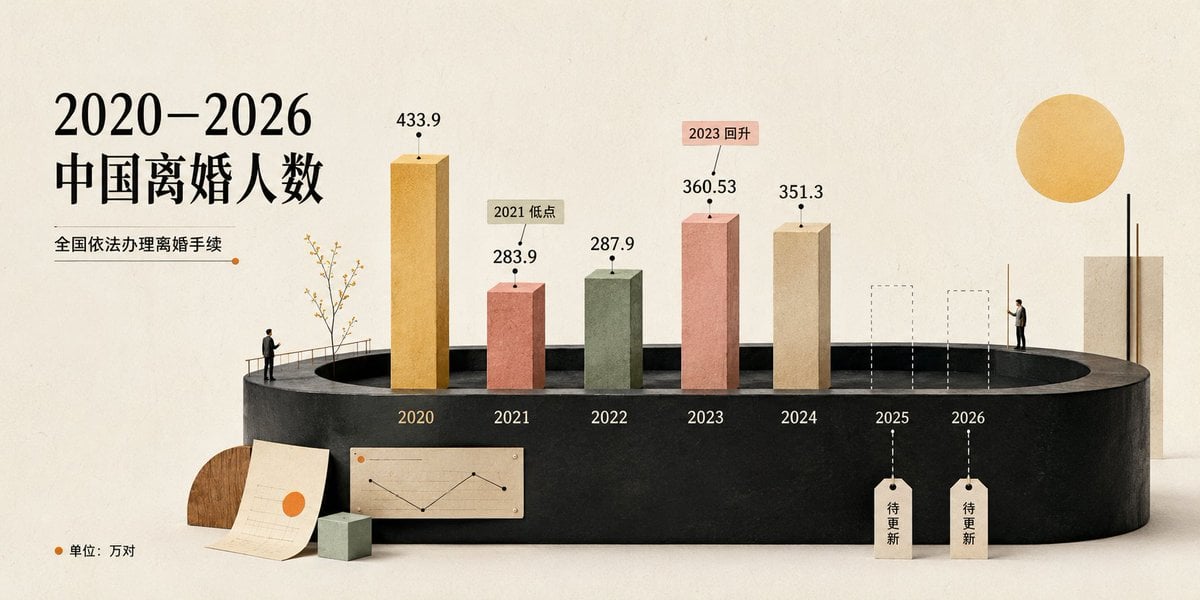
A refined 3D editorial infographic visualizing China divorce numbers from 2020 to 2026 with Chinese labels and future placeholders.
- Prompt included
- Model and format preset
- Premium template
The prompt behind this image
Copy the exact prompt behind China Divorce Data 3D Infographic, or open it in the studio and make it yours.
Goal: Create an elegant editorial-style 3D infographic about {argument name="headline topic" default="2020–2026 China divorce population"}, using Chinese typography and a minimalist museum-display aesthetic. Canvas: Wide horizontal 16:9 composition on warm off-white textured paper, soft studio lighting, subtle shadows, muted cream background. Layout: Place a large black Chinese headline on the upper left reading “2020–2026\n中国离婚人数”. Beneath it, add a smaller subtitle “全国依法办理离婚手续” with a thin horizontal line ending in a small orange dot. The main visual is a dark charcoal oval/cylindrical podium spanning the lower middle, with a recessed oval opening at the top like a stage. Along the podium front, label the years from left to right: 2020, 2021, 2022, 2023, 2024, 2025, 2026. Chart elements: Use exactly 7 vertical year positions. Show 5 solid rectangular 3D bars and 2 dashed-outline placeholder bars. The 5 solid bars are: 2020 tall ochre-gold bar labeled “433.9”; 2021 shorter dusty coral bar labeled “283.9” with a small callout tag “2021 低点”; 2022 muted sage-green bar labeled “287.9”; 2023 taller salmon-pink bar labeled “360.53” with a small callout tag “2023 回升”; 2024 beige stone bar labeled “351.3”. The 2 future placeholders are dashed transparent bars for 2025 and 2026, each with a hanging tag below reading “待更新”. Put small black dots and leader lines above each numeric value. Decorative details: Add two tiny human figures for scale: one standing on the left edge of the podium near a simple railing and sparse delicate branch/tree, another standing on the right side near the future bars. Add a large flat golden sun circle in the upper right. Add a tall cream rectangular slab on the far right behind the podium with a thin black vertical line in front. At the lower left, place a wooden semicircle, a leaning paper sheet with a small orange circle, a small pale green cube, and a miniature beige line-chart card attached to the podium front. Text and legend: In the bottom-left corner add an orange dot followed by “单位:万对”. Keep all visible text in Chinese as specified, with crisp black type and no extra labels. Visual style: Refined data-visualization poster, tactile paper texture, 3D clay/paper-cut look, muted ochre coral sage beige palette, high-end magazine infographic, clean negative space, realistic soft shadows, precise alignment. Constraints: Use exactly the 7 year positions and exactly the 5 solid bars plus 2 dashed future bars described above. Do not add watermarks, logos, extra charts, or additional people.
How to use China Divorce Data 3D Infographic in 3 steps
- 1Upload ImagePNG, JPG or paste
Add your photo
Upload the photo the template builds on. The prompt, model and format are already set.
- 2…a portrait of your subject in softgolden-hour light, 85mm…
Personalize
Edit the subject and creative details for your destination.
- 3Generate
Generate
Press Generate — your image is created in PicX Studio, so you can compare it with the original and refine one variable at a time.
More like this
Templates with the same subject, style or setup. Open one to see its prompt.
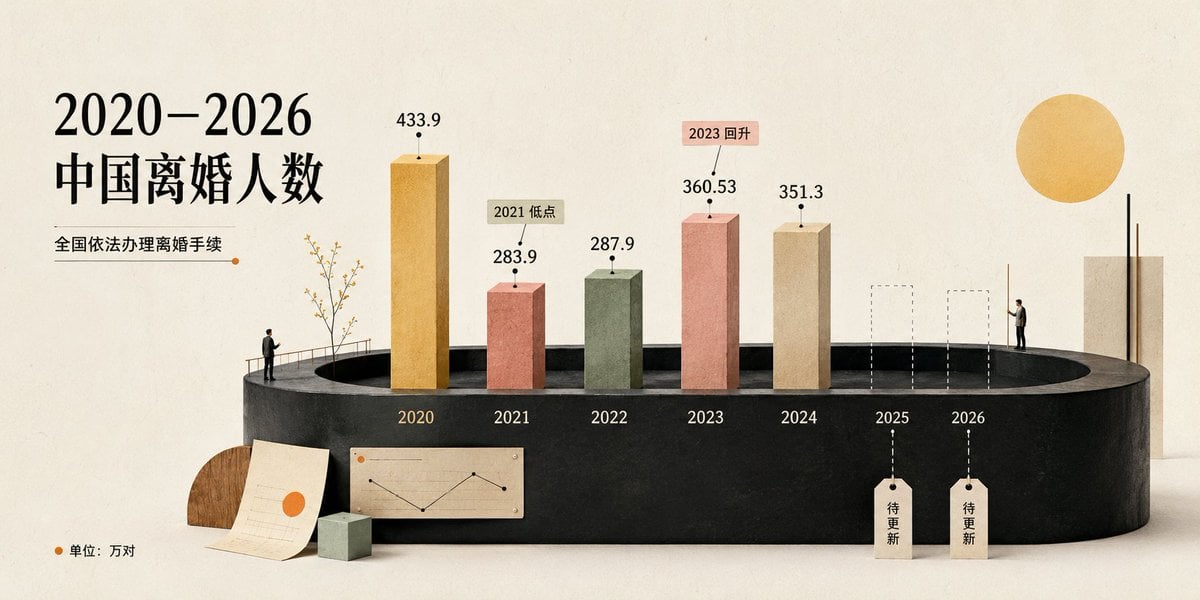
Cream 3D China Divorce Data Chart
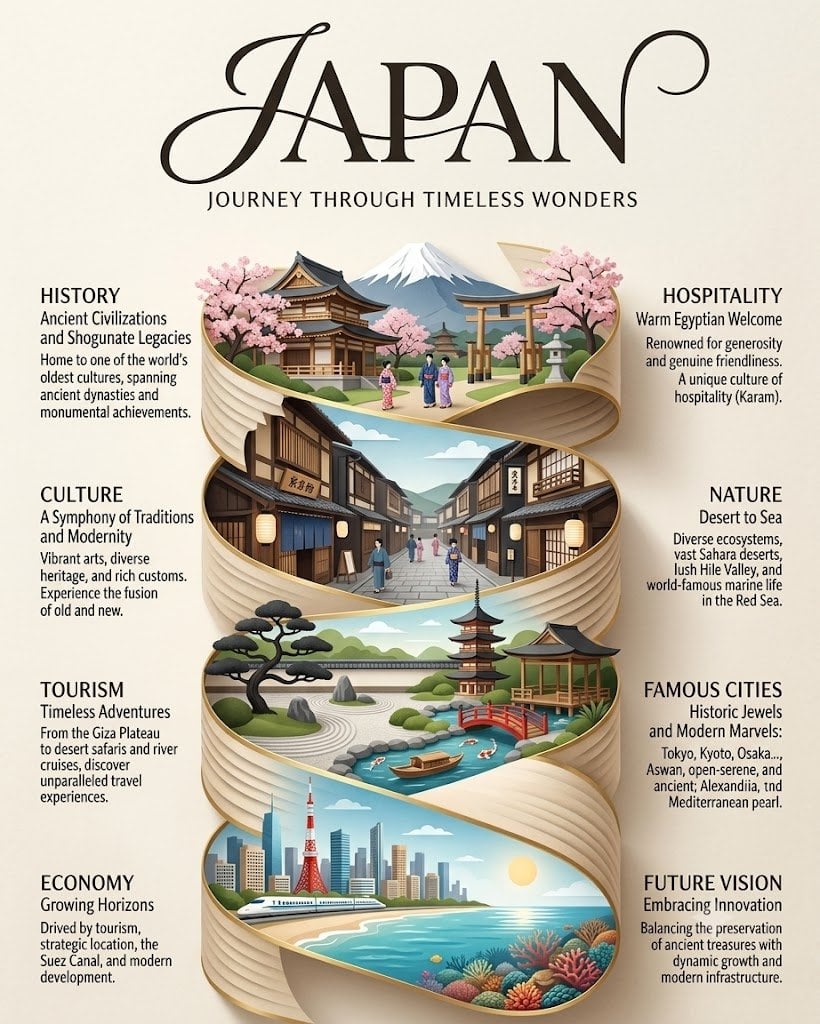
Japan Travel Brochure Poster
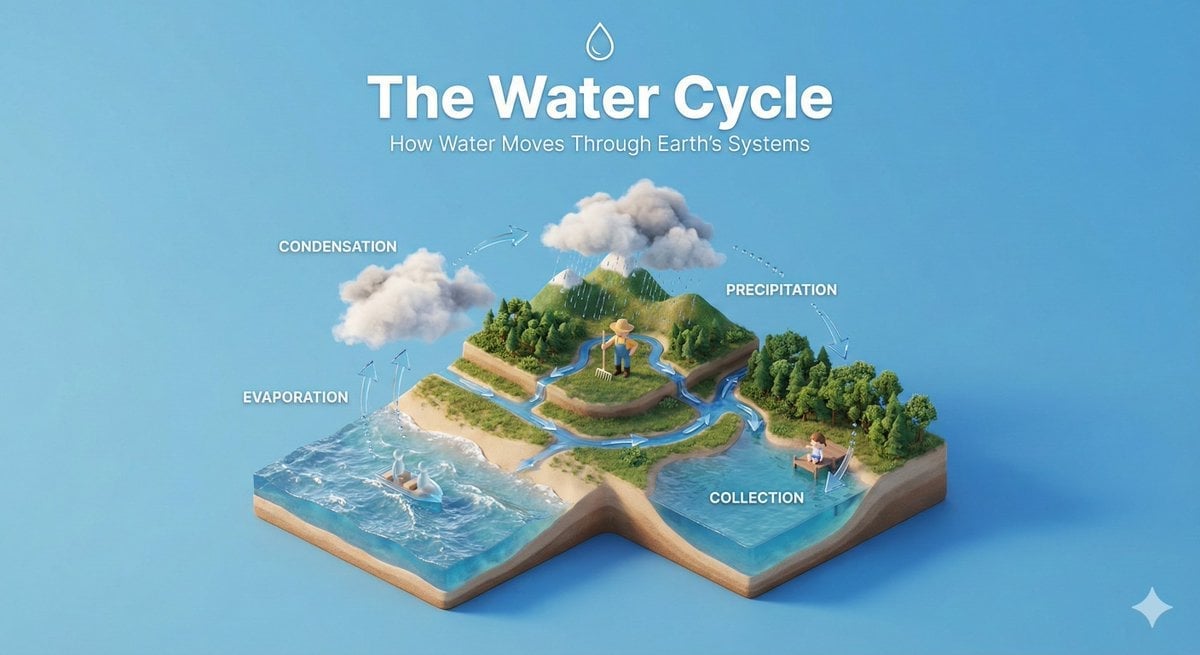
Isometric Process Educational Diorama
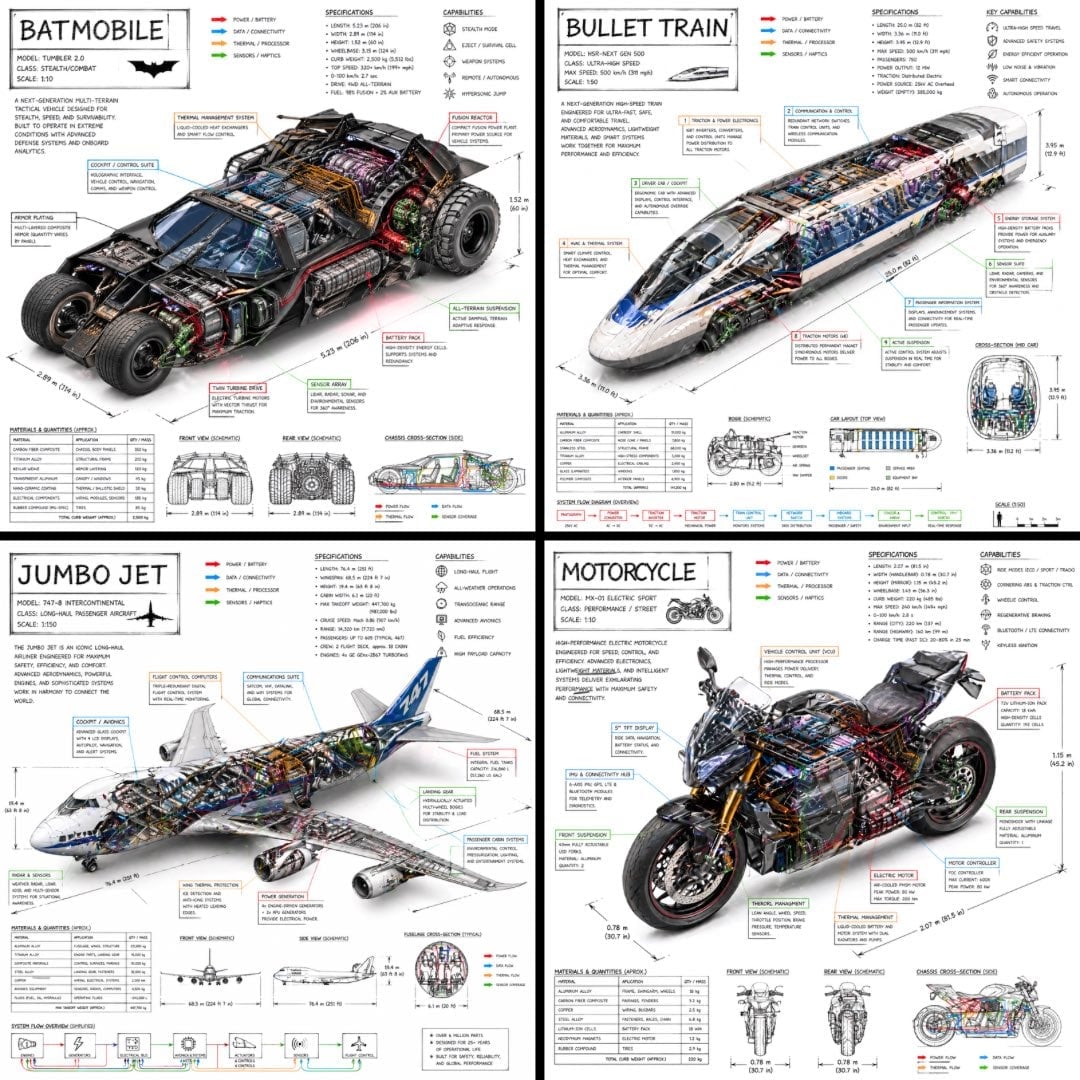
Isometric Vehicle Teardown Infographic Template

Gpt2 E Commerce Main Image Earbuds E Commerce Infographic

Gpt2 Infographic Edu Visual Alishan One Day Travel Poster

Gpt2 Infographic Edu Visual Ethnographic Plate for Tibetan Ceremonial Hat

Gpt2 Infographic Edu Visual Earth Signs Zodiac Character Poster

Gpt2 Infographic Edu Visual Water Signs Zodiac Character Poster
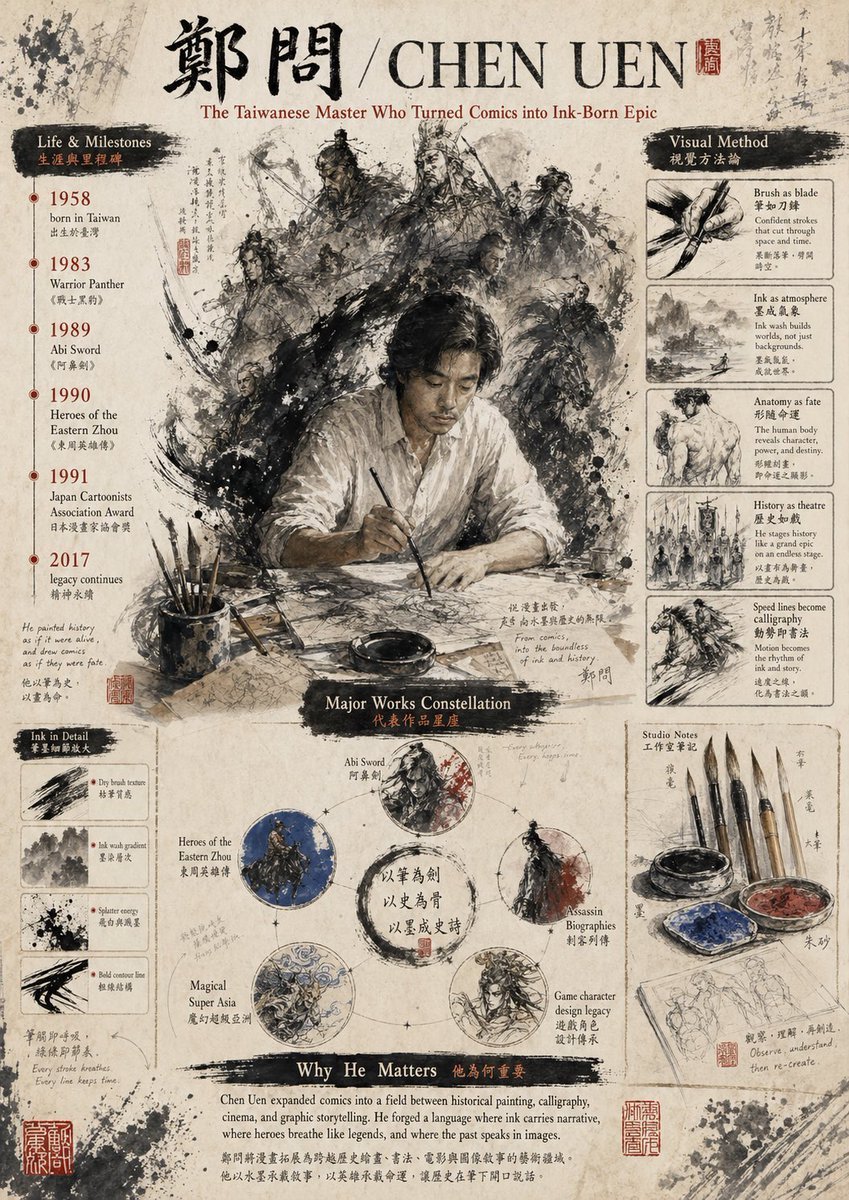
Gpt2 Infographic Edu Visual Ink Wash Tribute Poster for Chen Uen
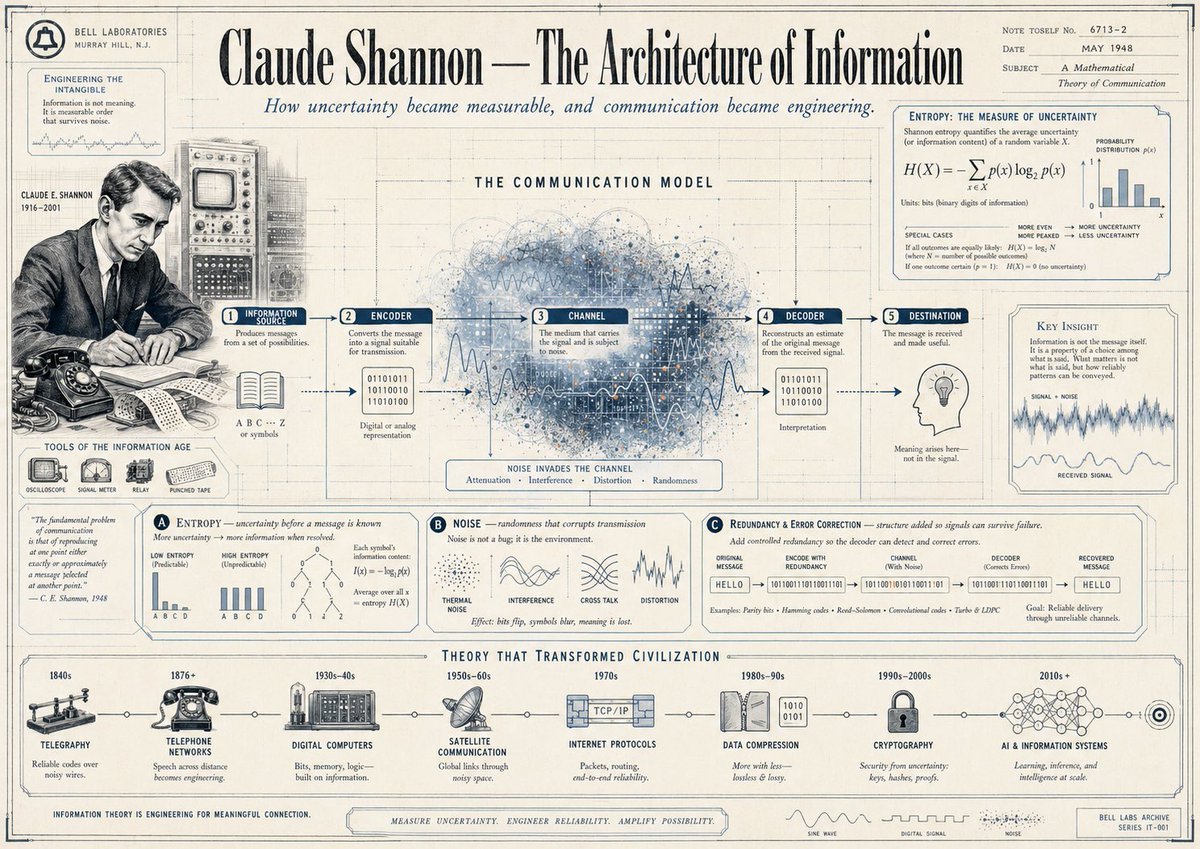
Gpt2 Infographic Edu Visual Vintage Claude Shannon Infographic Poster
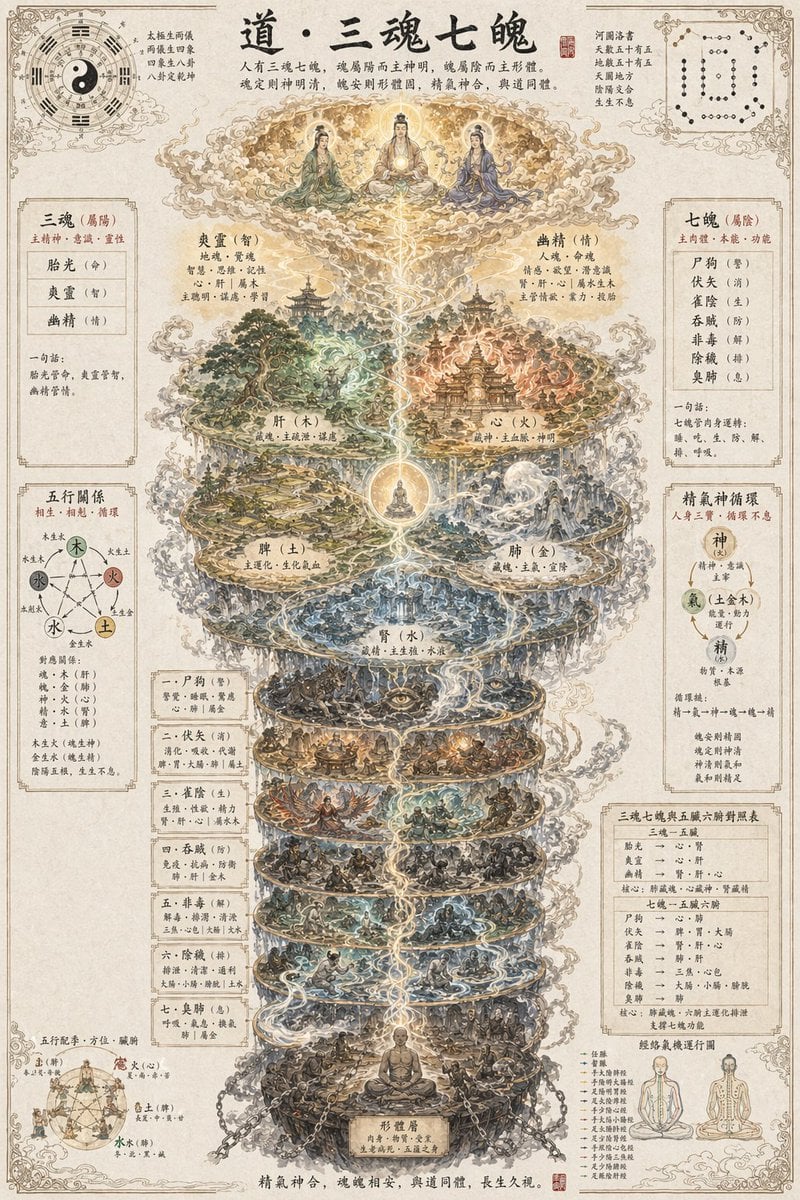
Gpt2 Infographic Edu Visual Taoist Three Souls Seven Po Poster
Make it yours
China Divorce Data 3D Infographic works as-is. These are the safest ways to change it without losing the look.
Change one field
Copy a single group, rewrite it, and generate again so you can see what that field is doing.
Keep the frame, change the subject
Hold the composition and light of China Divorce Data 3D Infographic, then swap wardrobe, props or the person for a new take.
| If the result… | Why | Fix |
|---|---|---|
| The result drifts from the preview | Too many fields changed at once. | Reuse China Divorce Data 3D Infographic as-is first, then change one group — subject, light, or setting. |
| The model over-stylizes the scene | The prose prompt leaves finish and camera underspecified. | Add one camera or lighting sentence and stay on GPT Image 2. |
More GPT Image 2 templates
Other prompts made for GPT Image 2.

Six VTuber Japanese Logo Sheet

Realistic Portrait of Woman and Deer

The Vista Modular Condo Poster
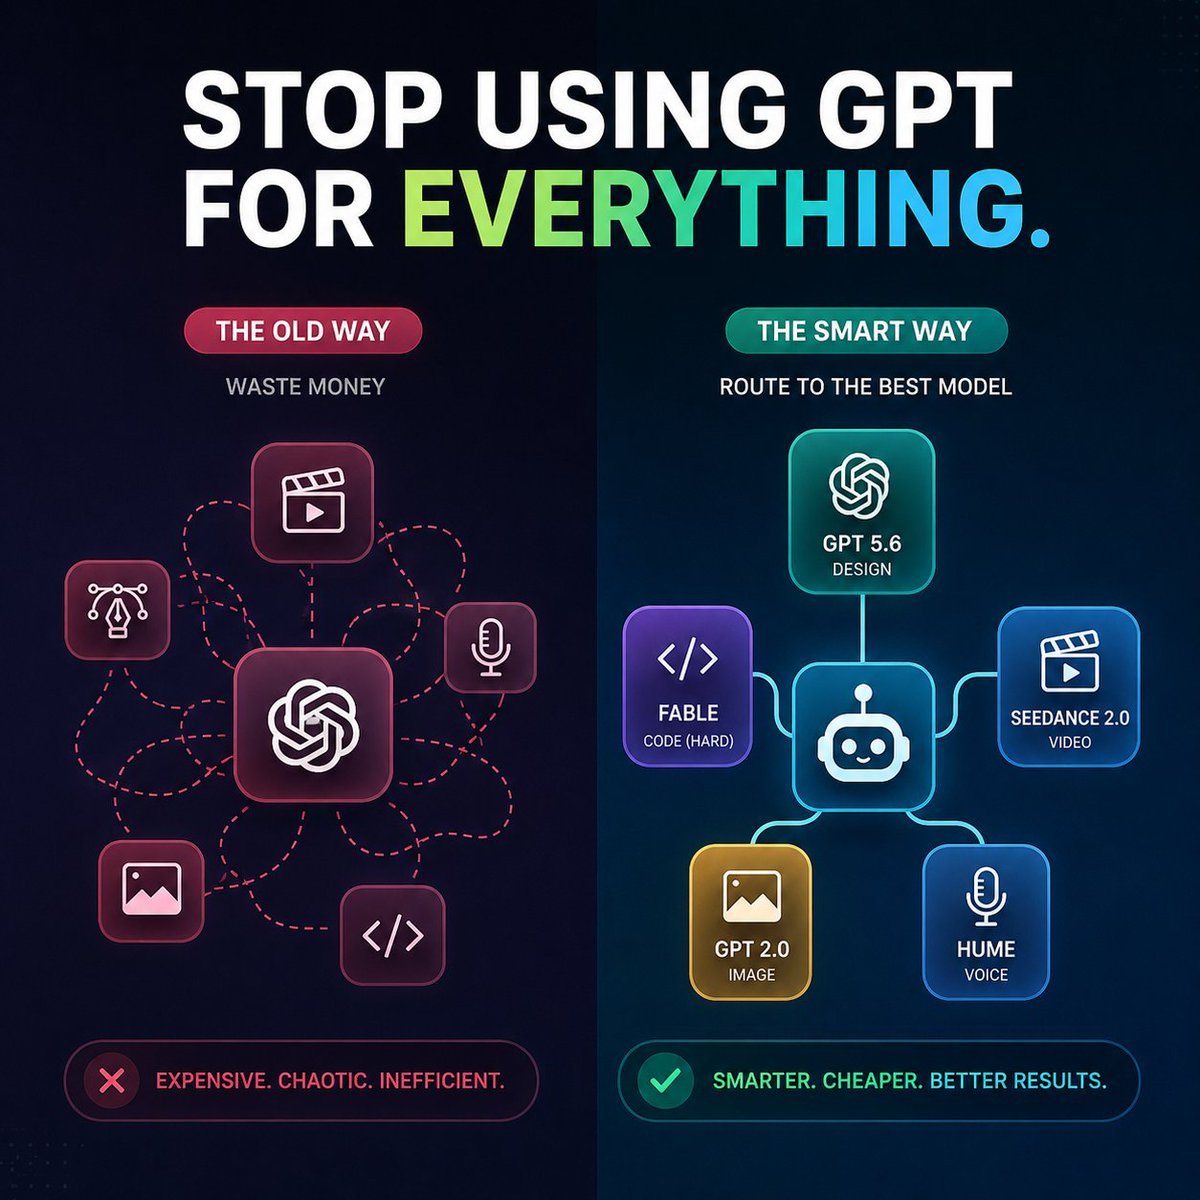
AI Model Routing Comparison Infographic

2.5D Anime Art Board

Isometric Productivity Desk Scene

New York Double Exposure Poster
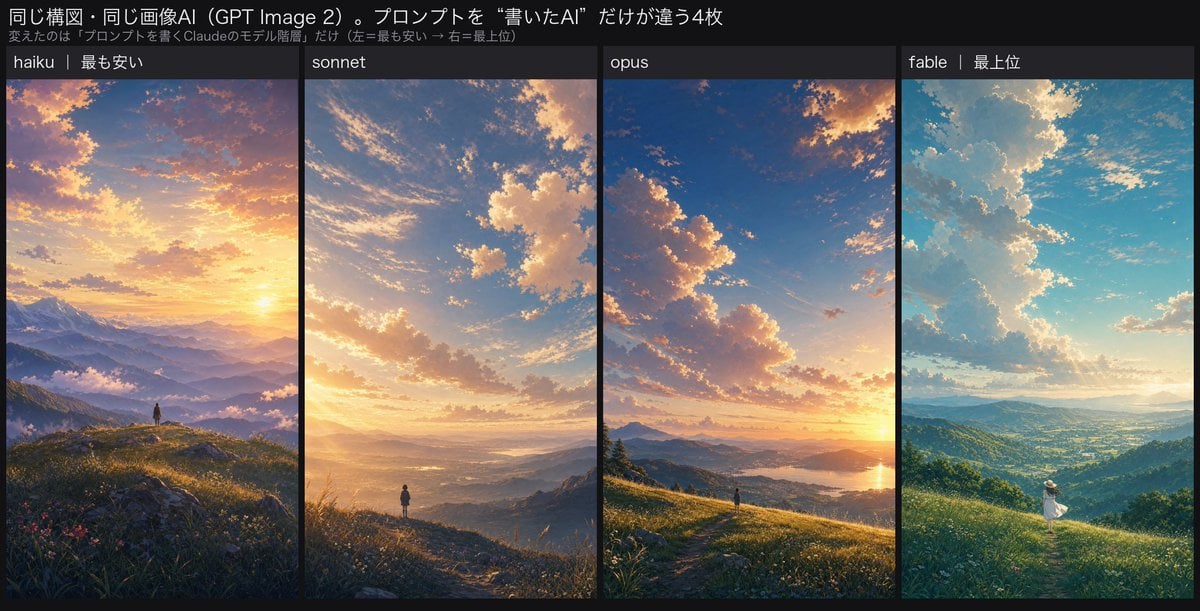
Four-Panel AI Landscape Comparison

Japanese Tatami Lifestyle Magazine Cover

NESCAFÉ Coffee Map Poster
More image prompts
Fresh picks from across the catalog.

Commercial Beauty Product Photograph

Ultra-Detailed 3D Plush Cartoon Character Rendering

Luxury Car Night Portrait with Direct Flash Photography

Action Kayaking Selfie Prompt for Google Gemini Nano Banana Pro 2.5

Creating a Thumbnail Image with Text Overlay
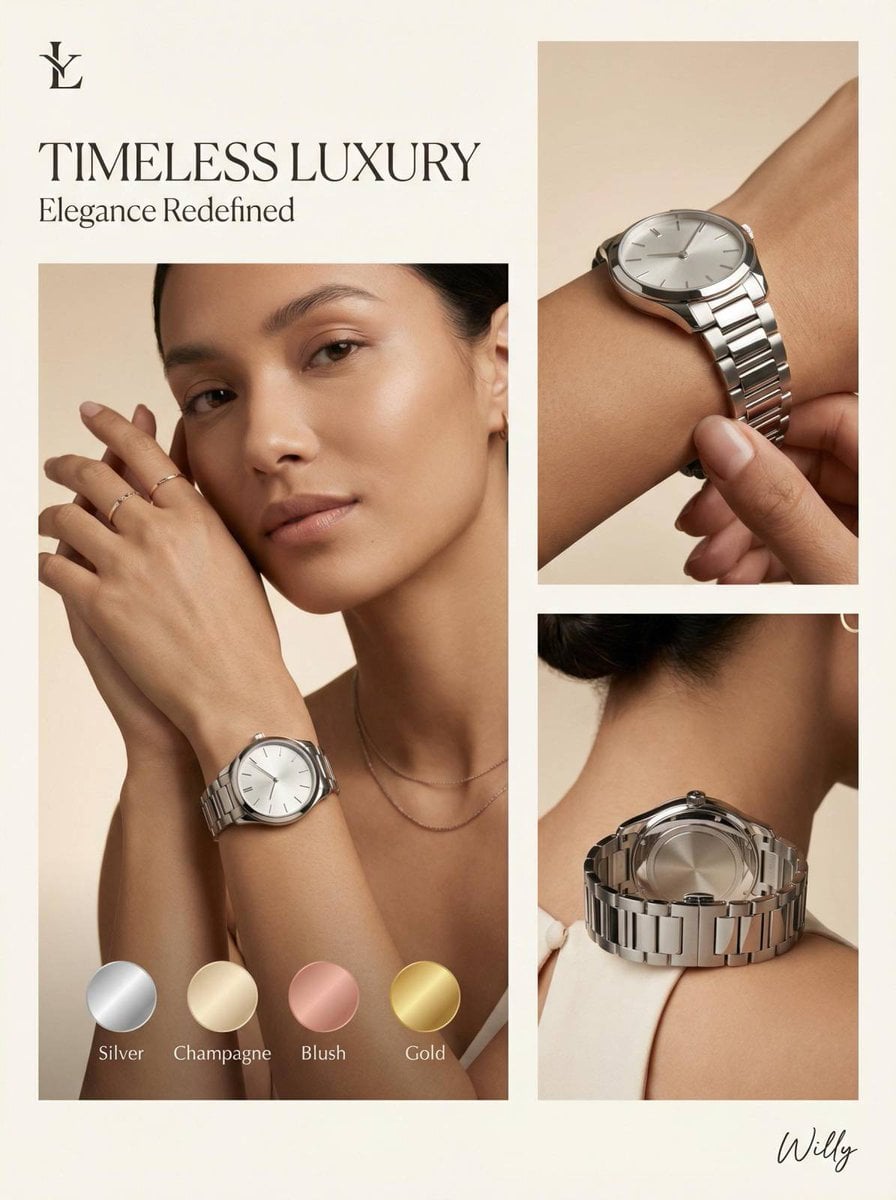
Luxury Watch Editorial Layout Prompt

X Profile Header Generation for Mom Blogger

Japanese New Year Kirie-Style Icon Set Generation

untitled

Energy Drink Product Explosion Commercial Prompt Template
Browse template categories
China Divorce Data 3D Infographic questions
How do I use the China Divorce Data 3D Infographic template?
Add your photo if the template asks for one, edit the prompt if you like — the template's model and format are already selected — and press Generate. Your version opens in PicX Studio.
Can I customize the China Divorce Data 3D Infographic template?
Yes. You can change the subject, setting, lighting, mood, format, and available model controls before creating your image.
Is the China Divorce Data 3D Infographic template free?
Opening and editing this template is free. Generating uses credits, shown on the Generate button when you are signed in.
Which AI model should I use?
Start with GPT Image 2, which is the model associated with this template. You can compare another compatible model for a different finish.
Looking for something else? Browse all templates.

Your photo, any look
Thousands of ready templates for every top image and video model, from one credit balance.