
Holographic Sci-Fi Operations Dashboard
Generates a cinematic neon glassmorphism command-center dashboard mockup for futuristic SaaS, DevOps, or AI agent monitoring prototypes.
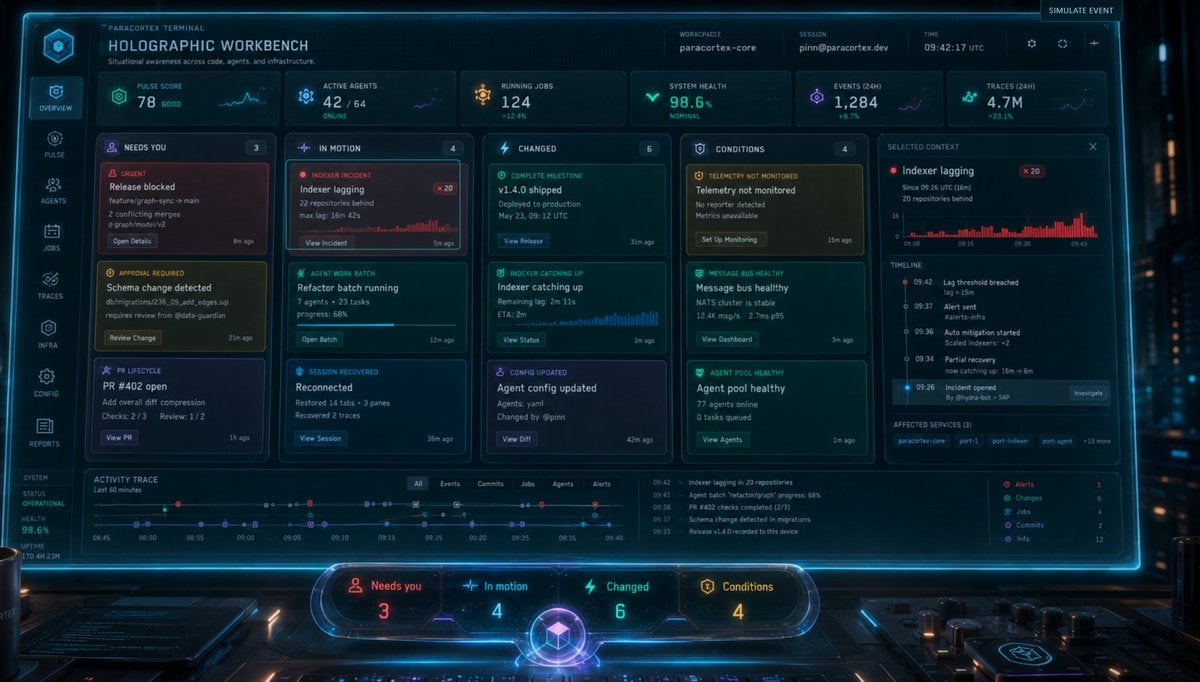
- Prompt included
- Model and format preset
- Free template
The prompt behind this image
Copy the exact prompt behind Holographic Sci-Fi Operations Dashboard, or open it in the studio and make it yours.
Goal: Create a cinematic sci-fi product mockup of a futuristic operations dashboard titled {argument name="product title" default="HOLOGRAPHIC WORKBENCH"}, floating as a transparent neon-blue holographic screen above a dark control desk in a cyberpunk command center. Canvas: Wide 16:9 landscape interface screenshot, dark navy/black glassmorphism UI, glowing cyan borders, subtle scanlines, tiny grid texture, high detail, realistic GPT-image-2 style render, shallow depth of field with blurred server lights in the background. The interface should feel like a clickable prototype built on top of a beautiful concept render. Header: Top-left brand text reads “PARACORTEX TERMINAL” above the main title “HOLOGRAPHIC WORKBENCH” with the subtitle “Situational awareness across code, agents, and infrastructure.” Top-center metadata shows exactly 3 fields: Workspace “paracortex-core”, Session “[email protected]”, Time “09:42:17 UTC”. Top-right includes a small button labeled “SIMULATE EVENT” plus tiny gear, sync, and plus icons. Left navigation: A vertical glowing sidebar with exactly 8 icon navigation items labeled, from top to bottom: Overview, Pulse, Agents, Jobs, Traces, Infra, Config, Reports. At the lower left, include a small system status panel with Status “Operational”, Health “98.6%”, and Uptime “170 4H 23M”. Top metric row: Show exactly 6 stat cards across the top. Card 1: “PULSE SCORE” value “78” status “GOOD” with a small line graph. Card 2: “ACTIVE AGENTS” value “42 / 64” status “ONLINE”. Card 3: “RUNNING JOBS” value “124” status “+12.4%”. Card 4: “SYSTEM HEALTH” value “98.6%” status “NOMINAL”. Card 5: “EVENTS (24H)” value “1,284” status “+8.7%”. Card 6: “TRACES (24H)” value “4.7M” status “+23.1%”. Main layout: Beneath the metric row, create exactly 5 large vertical columns/cards. Column 1 is “NEEDS YOU” with badge count 3 and exactly 3 task cards: “Release blocked” with urgent red styling, “Schema change detected” with yellow approval styling, and “PR #402 open” with purple lifecycle styling. Column 2 is “IN MOTION” with badge count 4 and exactly 3 visible task cards: “Indexer lagging” as a red incident with small x20 badge and tiny bar chart, “Refactor batch running” with teal progress bar, and “Reconnected” with blue session recovered styling. Column 3 is “CHANGED” with badge count 6 and exactly 3 task cards: “v1.4.0 shipped”, “Indexer catching up” with mini bar chart, and “Agent config updated”. Column 4 is “CONDITIONS” with badge count 4 and exactly 3 task cards: “Telemetry not monitored”, “Message bus healthy”, and “Agent pool healthy”. Column 5 is a right-side “SELECTED CONTEXT” details panel focused on {argument name="selected incident" default="Indexer lagging"}, showing a red x20 badge, a red histogram, a vertical timeline with timestamps, and affected service chips. Selected context details: The right detail panel should include title “Indexer lagging”, subtext “Since 09:25 UTC (16m)” and “20 repositories behind”. Add a red bar chart labeled along the bottom with times around 09:00, 09:15, 09:30, 09:45. Timeline contains exactly 5 entries: “09:42 Lag threshold breached”, “09:37 Alert sent”, “09:36 Auto mitigation started”, “09:34 Partial recovery”, and “09:26 Incident opened”. Add a small button labeled “Investigate”. Affected services chips: “paracortex-core”, “port-1”, “port-indexer”, “port-agent”, “+15 more”. Bottom activity area: Add an “ACTIVITY TRACE” panel spanning the width under the main columns, labeled “Last 60 minutes”. Include a horizontal time-based trace with multicolored dots, small filter tabs exactly 6: “All”, “Events”, “Commits”, “Jobs”, “Agents”, “Alerts”. On the right of this panel, include a compact event list and a tiny legend with exactly 6 categories: Alerts, Changes, Jobs, Commits, Infra, Info. Foreground controls: At the bottom center, place a separate rounded glass status dock floating in front of the screen. It contains exactly 4 large counters matching the columns: “Needs you 3” in red, “In motion 4” in blue, “Changed 6” in teal, and “Conditions 4” in amber. In the center bottom of the dock, include a glowing purple-blue cube orb emblem. Color and style: Use neon cyan outlines, teal and electric blue glow, red for incidents, amber for warnings, purple for lifecycle/session items. UI panels are translucent dark glass with rounded corners. Text is small but mostly legible, technical, dense, and polished. Add subtle reflections on the desk, small physical knobs and screens at the bottom edge, and atmospheric blue light beams. Constraints: Keep all listed counts exact: 8 sidebar items, 6 top metric cards, 5 main columns, 15 total visible main task/detail cards if counting the right selected context panel, 6 filter tabs, 6 legend categories, and 4 dock counters. Do not add people. Do not use a flat white background. Avoid cartoon styling; make it look like a premium sci-fi SaaS dashboard prototype.
How to use Holographic Sci-Fi Operations Dashboard in 3 steps
- 1Upload ImagePNG, JPG or paste
Add your photo
Upload the photo the template builds on. The prompt, model and format are already set.
- 2…a portrait of your subject in softgolden-hour light, 85mm…
Personalize
Edit the subject and creative details for your destination.
- 3Generate
Generate
Press Generate — your image is created in PicX Studio, so you can compare it with the original and refine one variable at a time.
More like this
Templates with the same subject, style or setup. Open one to see its prompt.
Cinematic Sci-Fi Interface Side Profile

Korean Idol Partial Shadow Editorial Portrait
Neon Violet Streetwear Fashion Portrait
Futuristic Holographic Dashboard
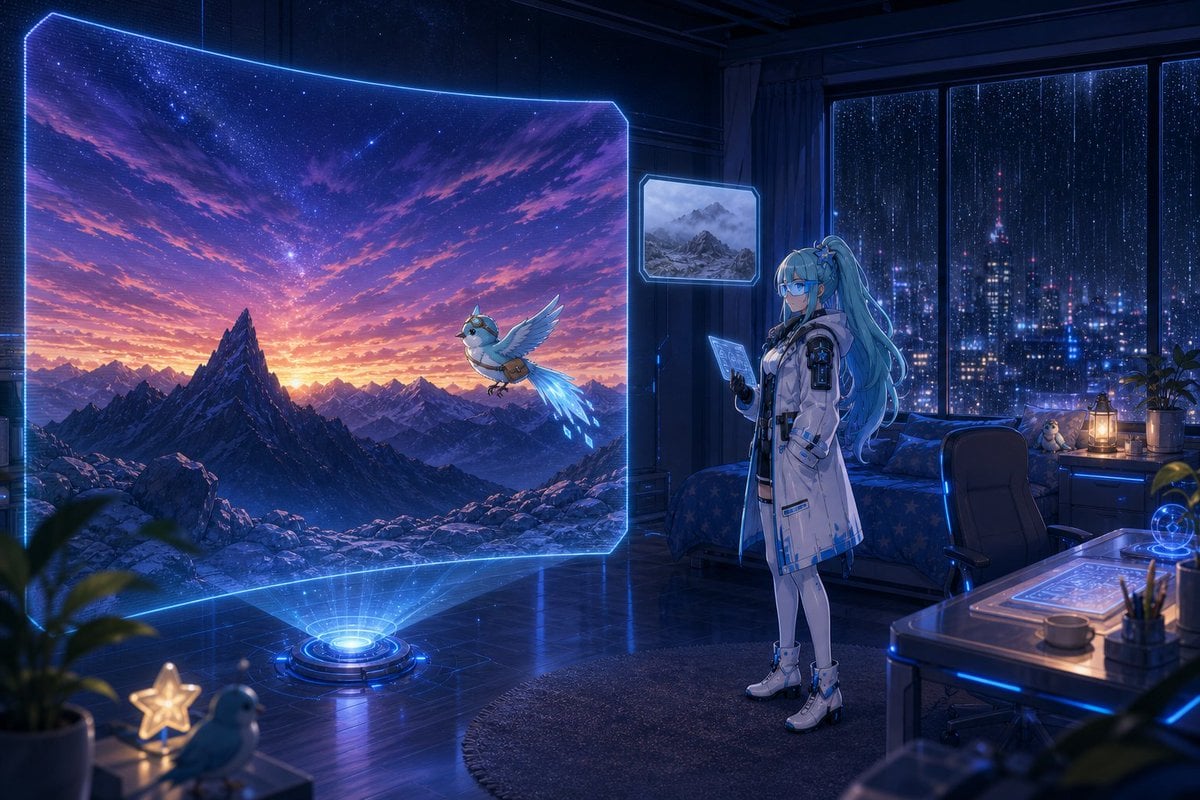
Holographic Mountain Bedroom
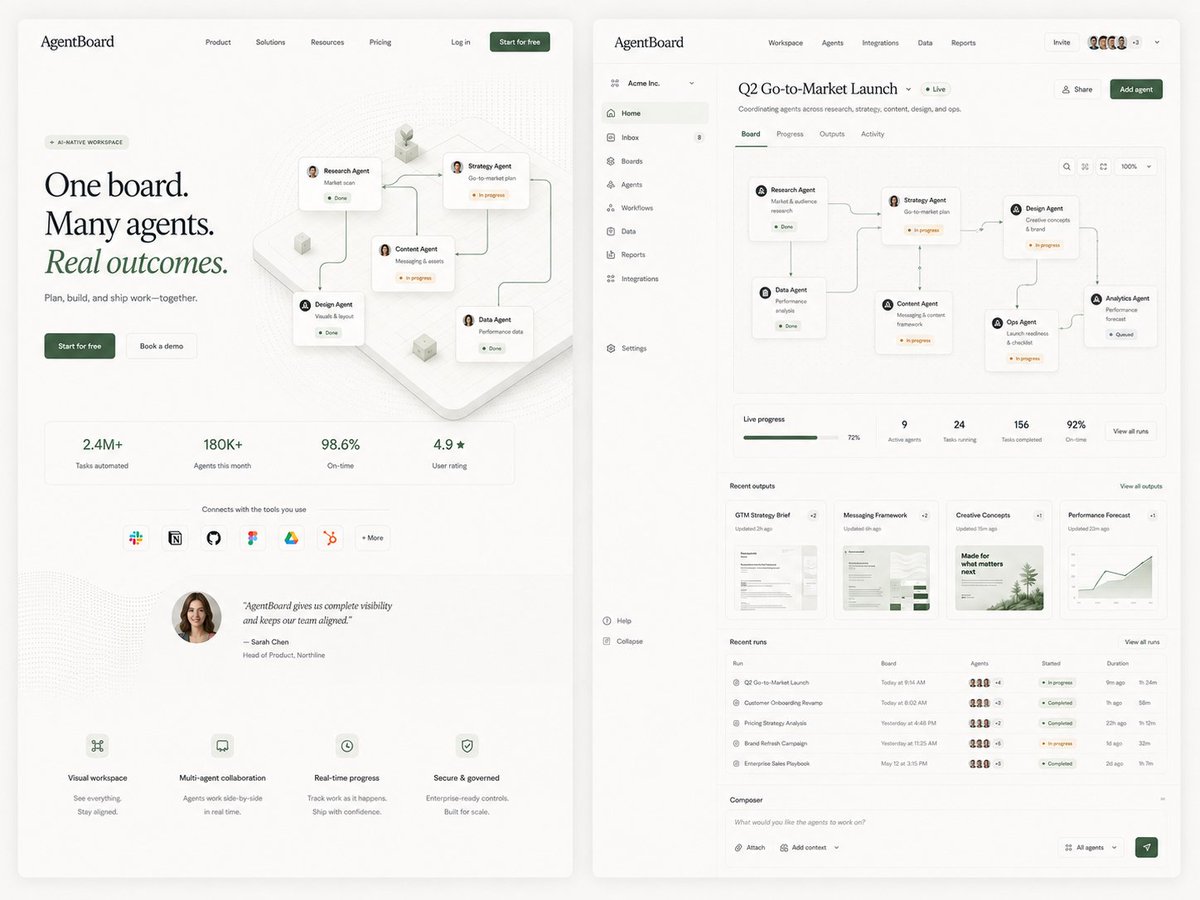
AgentBoard SaaS Landing and Dashboard UI
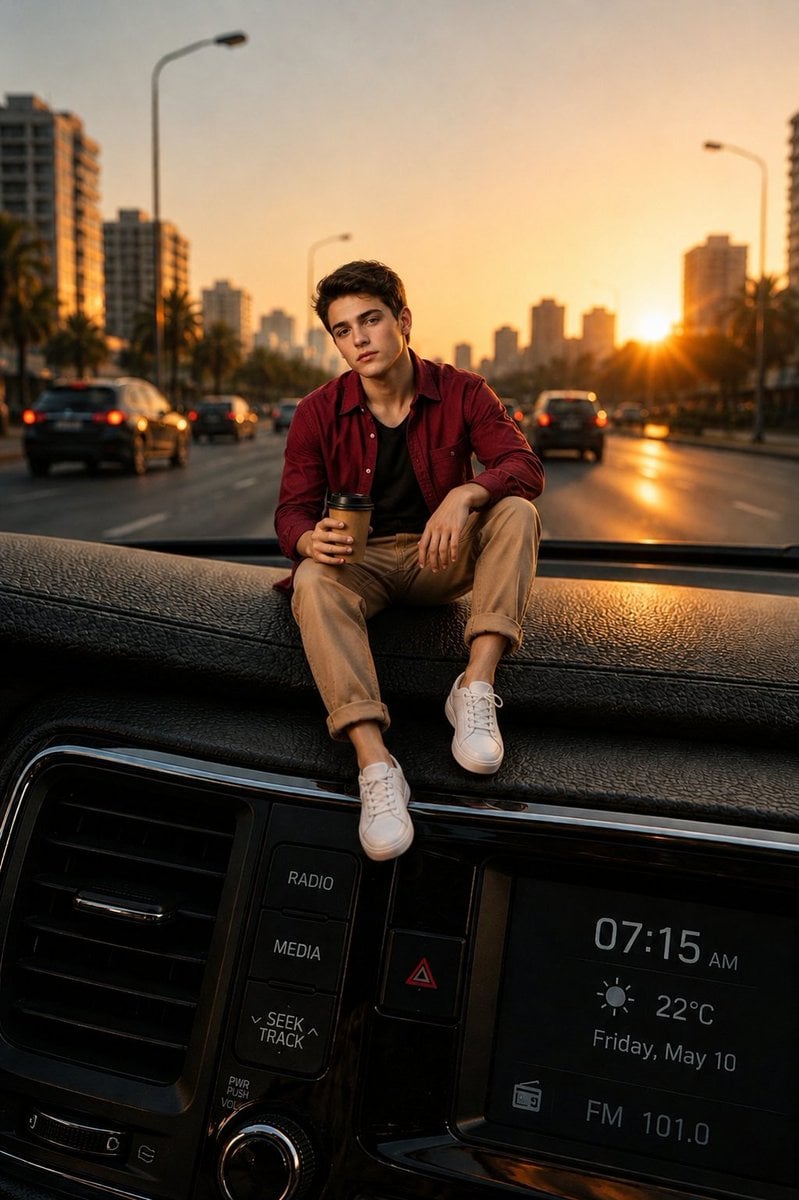
Miniature Man on Car Dashboard
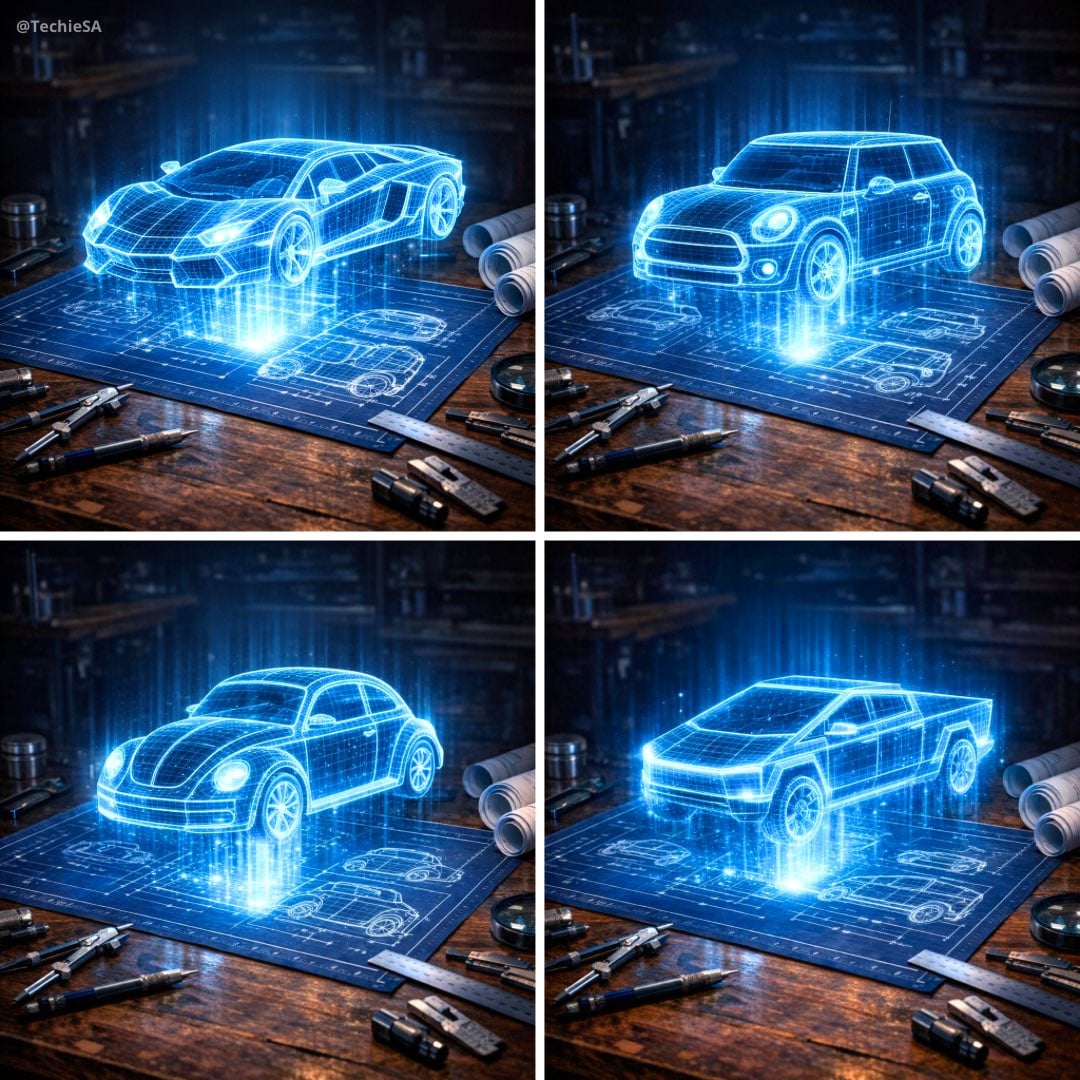
Holographic Car Blueprint Wireframe
Sci-Fi AI Battle Movie Poster
Fintech Crypto Dashboard UI Design
Sci-Fi Knight of the Order
Pregnant Woman in Retro Sci-Fi Medical Pod
Make it yours
Holographic Sci-Fi Operations Dashboard works as-is. These are the safest ways to change it without losing the look.
Change one field
Copy a single group, rewrite it, and generate again so you can see what that field is doing.
Keep the frame, change the subject
Hold the composition and light of Holographic Sci-Fi Operations Dashboard, then swap wardrobe, props or the person for a new take.
| If the result… | Why | Fix |
|---|---|---|
| The result drifts from the preview | Too many fields changed at once. | Reuse Holographic Sci-Fi Operations Dashboard as-is first, then change one group — subject, light, or setting. |
| The model over-stylizes the scene | The prose prompt leaves finish and camera underspecified. | Add one camera or lighting sentence and stay on GPT Image 2. |
More GPT Image 2 templates
Other prompts made for GPT Image 2.
Six VTuber Japanese Logo Sheet

Realistic Portrait of Woman and Deer
The Vista Modular Condo Poster
AI Model Routing Comparison Infographic
2.5D Anime Art Board

Isometric Productivity Desk Scene

New York Double Exposure Poster
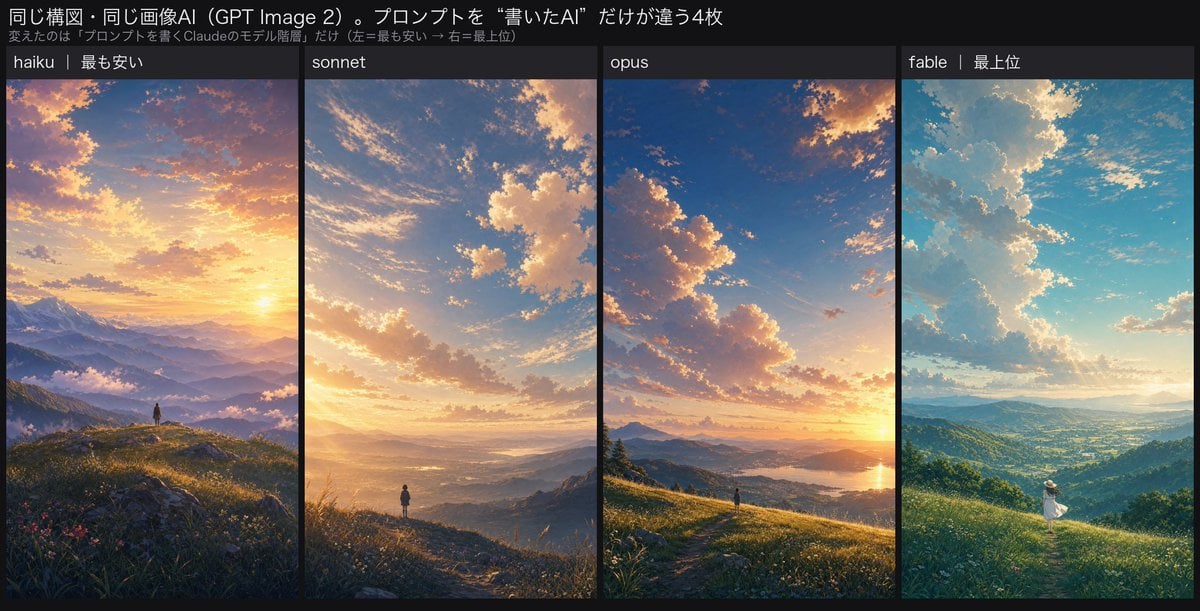
Four-Panel AI Landscape Comparison

Japanese Tatami Lifestyle Magazine Cover

NESCAFÉ Coffee Map Poster
More image prompts
Fresh picks from across the catalog.

European Urban Menswear Style Portrait

Split Portrait Editorial Photography
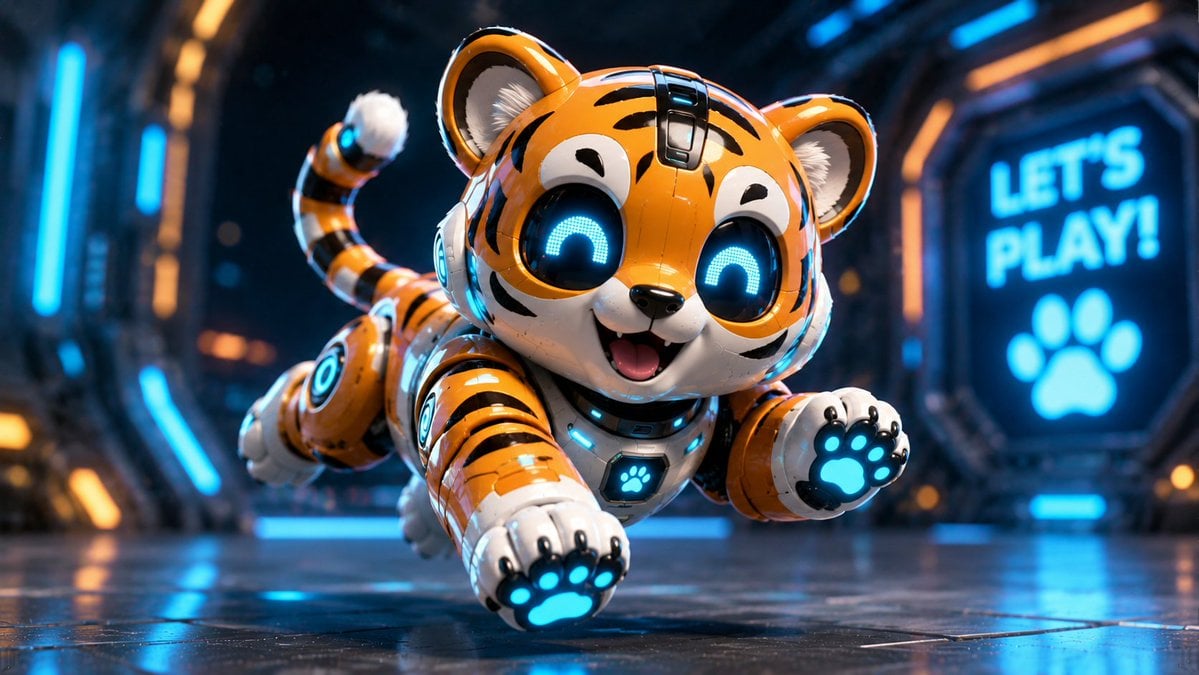
Miniature Sci-Fi Companion Robot
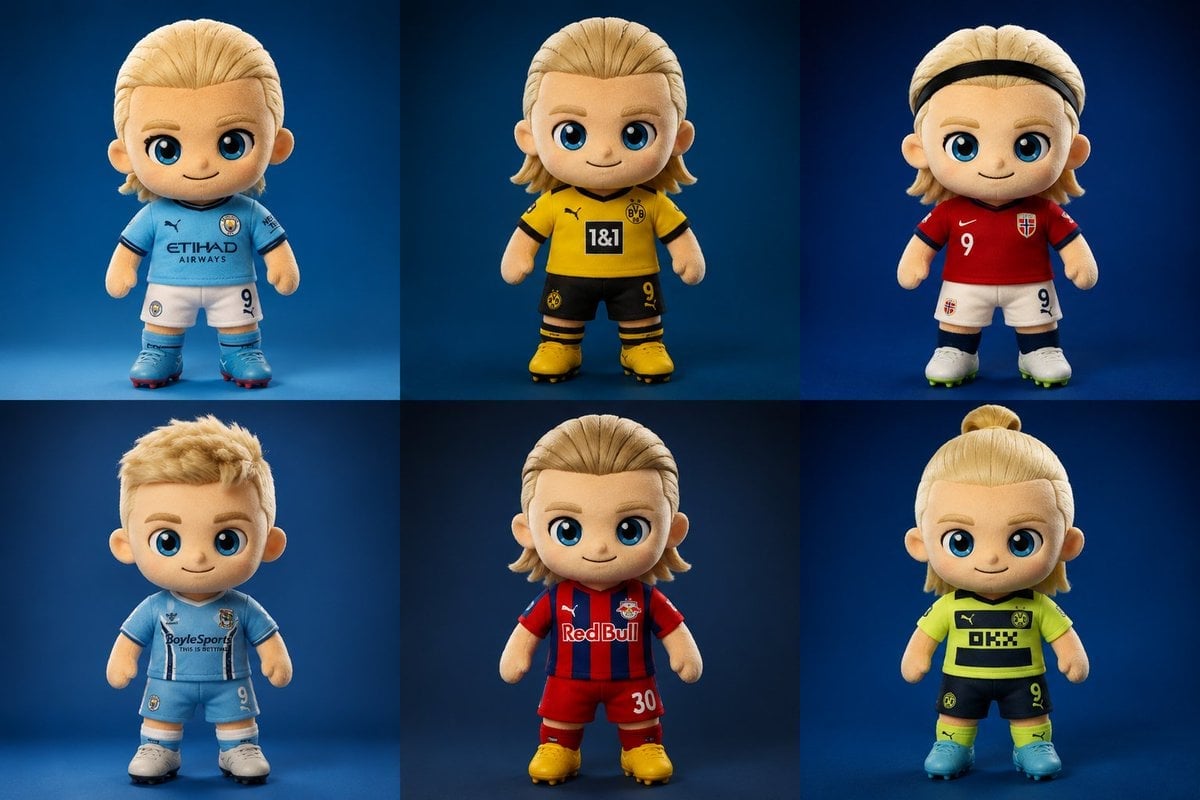
Plush Chibi Soccer Mascot
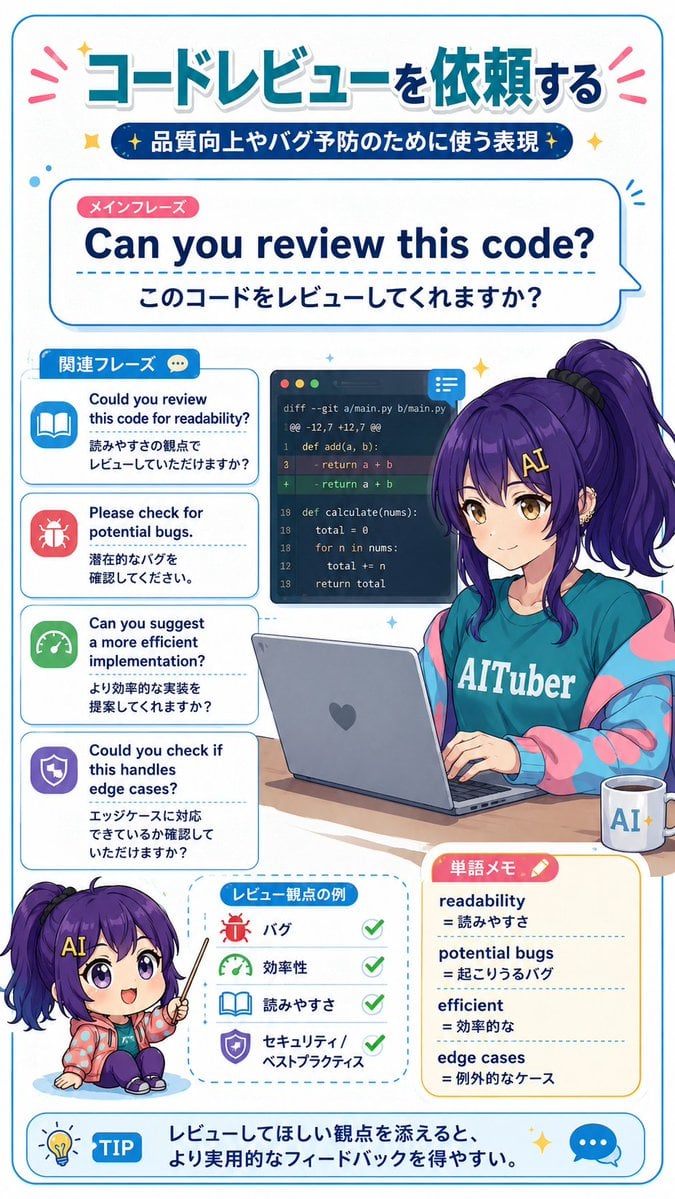
Code Review English Infographic

Birthday Celebration Neon Poster Collage Prompt
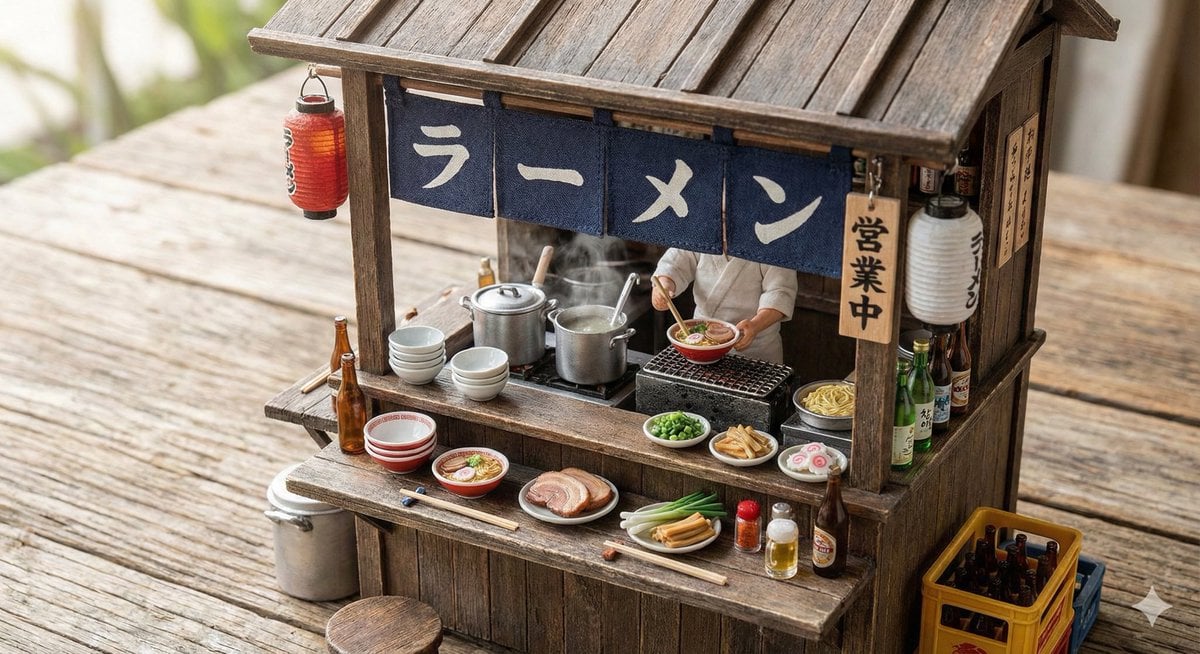
Generating Various Everyday Scenes
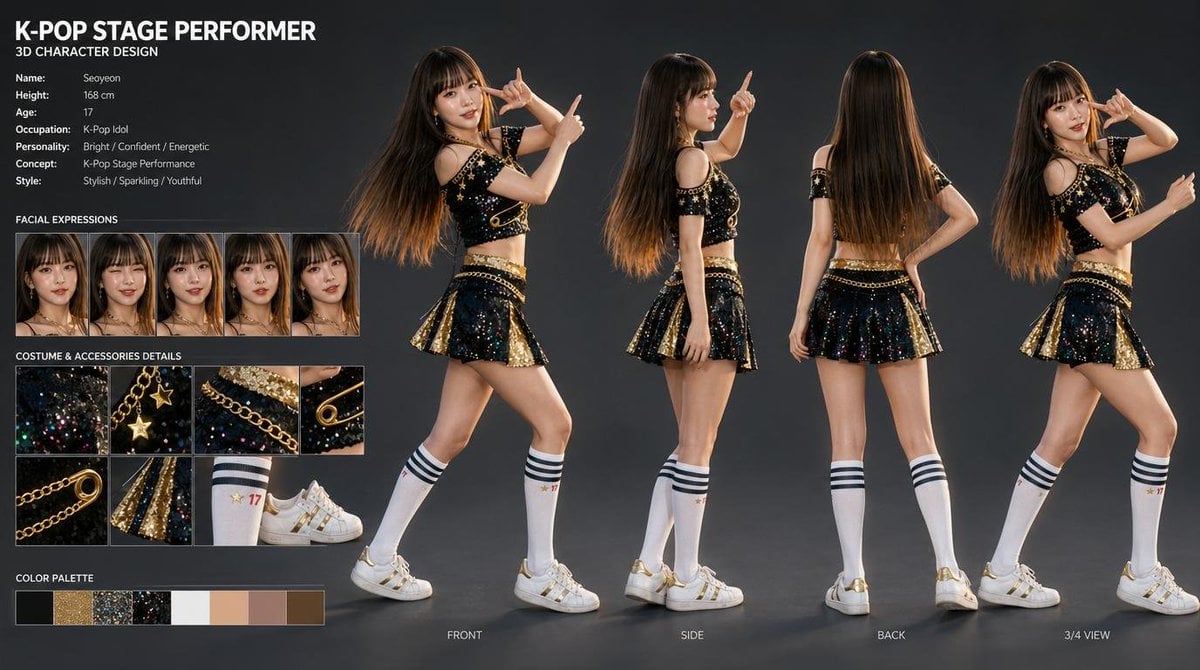
K-Pop Idol 3D Character Sheet
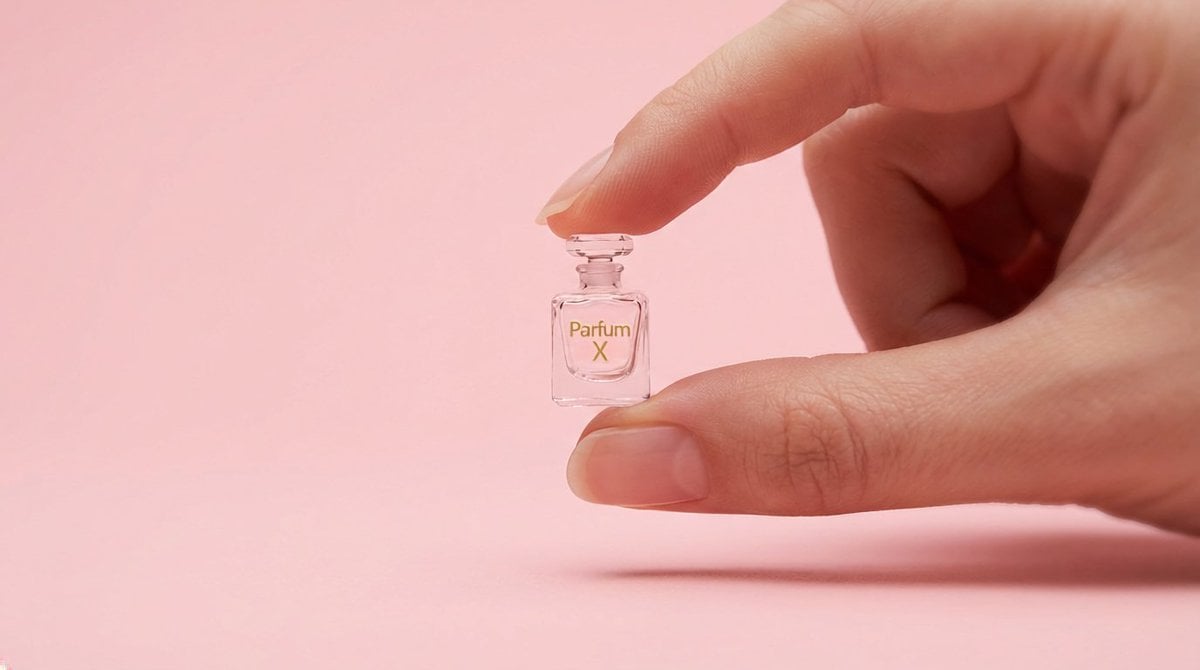
Hyper-Realistic Miniature Product Ad Prompt
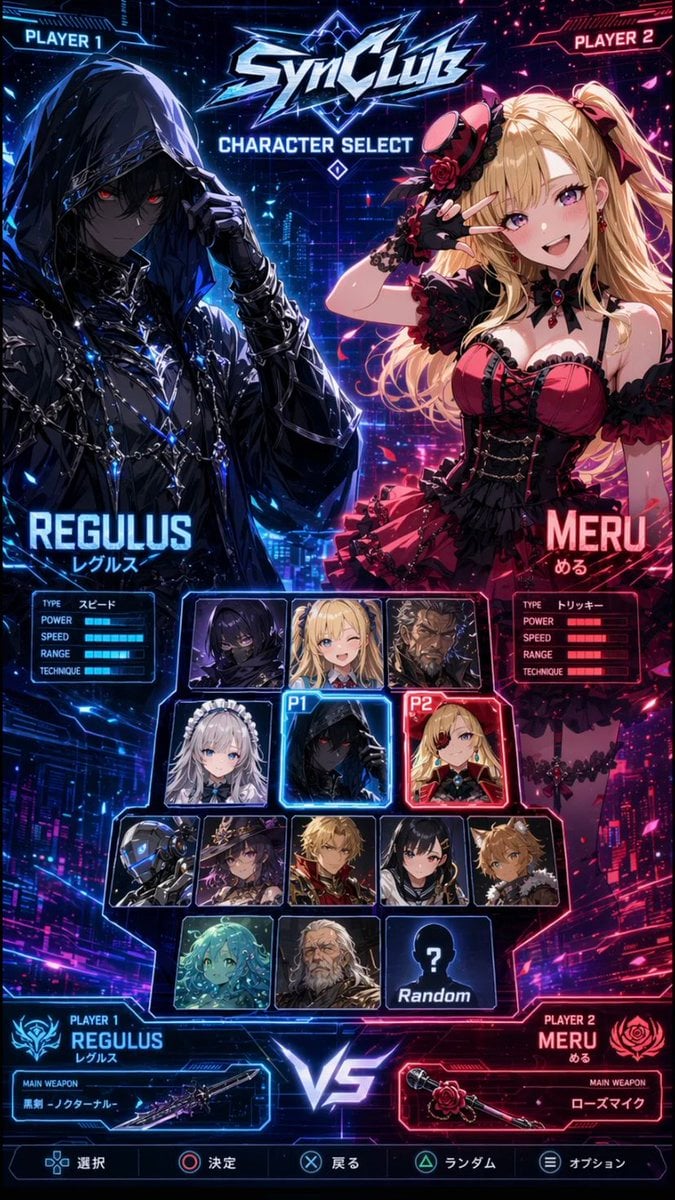
Cyberpunk Anime Character Select Screen
Browse template categories
Holographic Sci-Fi Operations Dashboard questions
How do I use the Holographic Sci-Fi Operations Dashboard template?
Add your photo if the template asks for one, edit the prompt if you like — the template's model and format are already selected — and press Generate. Your version opens in PicX Studio.
Can I customize the Holographic Sci-Fi Operations Dashboard template?
Yes. You can change the subject, setting, lighting, mood, format, and available model controls before creating your image.
Is the Holographic Sci-Fi Operations Dashboard template free?
Opening and editing this template is free. Generating uses credits, shown on the Generate button when you are signed in.
Which AI model should I use?
Start with GPT Image 2, which is the model associated with this template. You can compare another compatible model for a different finish.
Looking for something else? Browse all templates.

Your photo, any look
Thousands of ready templates for every top image and video model, from one credit balance.