
Editorial Dual-Axis Data Infographic
Generates a clean, newspaper-style dual-axis line chart with annotations and a callout box, ideal for comparing contrasting data trends.
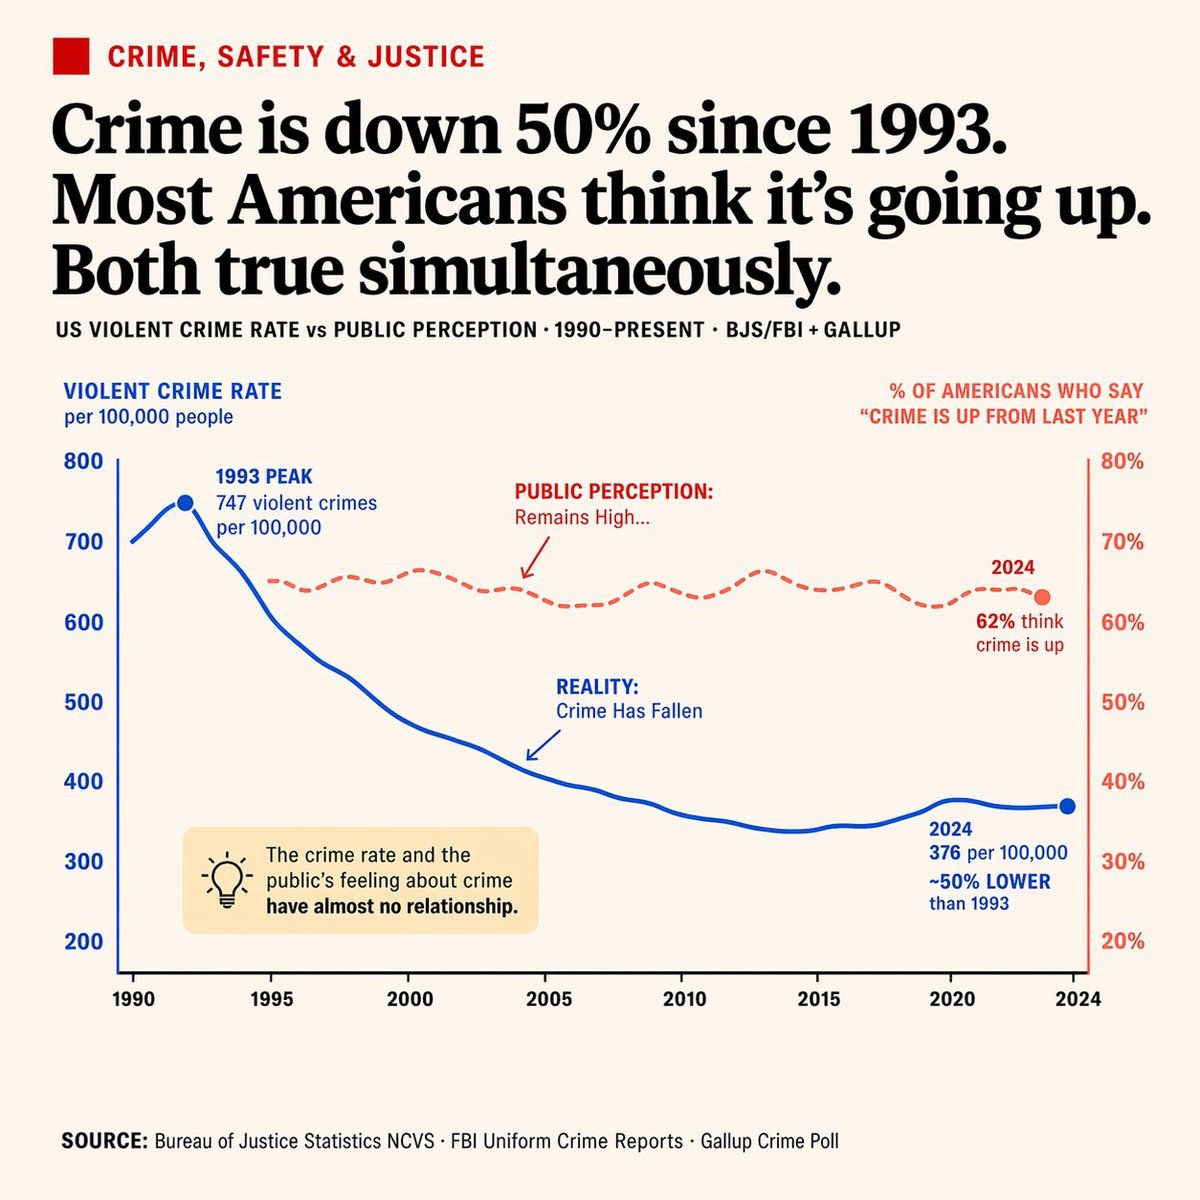
- Prompt included
- Model and format preset
- Free template
The prompt behind this image
Copy the exact prompt behind Editorial Dual-Axis Data Infographic, or open it in the studio and make it yours.
- Type
- editorial infographic dual-axis line chart
- Style
- clean, newspaper-style, off-white background, highly legible typography
- Header › Category
- CRIME, SAFETY & JUSTICE (red text with red square icon)
- Header › Headline
- {argument name="main headline" default="Crime is down 50% since 1993. Most Americans think it's going up. Both true simultaneously."}
- Header › Sub Headline
- US VIOLENT CRIME RATE vs PUBLIC PERCEPTION · 1990-PRESENT · BJS/FBI + GALLUP
- Chart › X Axis
- Years 1990 to 2024 with 8 tick marks
- Chart › Left Y Axis › Color
- blue
- Chart › Left Y Axis › Label
- {argument name="left axis label" default="VIOLENT CRIME RATE per 100,000 people"}
- Chart › Left Y Axis › Range
- 200 to 800
- Chart › Right Y Axis › Color
- red
- Chart › Right Y Axis › Label
- {argument name="right axis label" default="% OF AMERICANS WHO SAY 'CRIME IS UP FROM LAST YEAR'"}
- Chart › Right Y Axis › Range
- 20% to 80%
- Chart › Data Series › 0 › Name
- Reality
- Chart › Data Series › 0 › Style
- solid blue line
- Chart › Data Series › 0 › Trend
- peaks early then drops significantly
- Chart › Data Series › 0 › Annotations
- 1993 PEAK 747 violent crimes per 100,000 (with blue dot), REALITY: Crime Has Fallen (with blue arrow pointing to line), 2024 376 per 100,000 ~50% LOWER than 1993 (with blue dot)
- Chart › Data Series › 1 › Name
- Public Perception
- Chart › Data Series › 1 › Style
- dashed red line
- Chart › Data Series › 1 › Trend
- remains relatively flat and high
- Chart › Data Series › 1 › Annotations
- PUBLIC PERCEPTION: Remains High... (with red arrow pointing to line), 2024 62% think crime is up (with red dot)
- Callout Box › Position
- bottom left inside chart area
- Callout Box › Style
- light yellow rectangle
- Callout Box › Icon
- lightbulb
- Callout Box › Text
- {argument name="callout text" default="The crime rate and the public's feeling about crime have almost no relationship."}
Raw JSON
{
  "type": "editorial infographic dual-axis line chart",
  "style": "clean, newspaper-style, off-white background, highly legible typography",
  "header": {
    "category": "CRIME, SAFETY & JUSTICE (red text with red square icon)",
    "headline": "{argument name=\"main headline\" default=\"Crime is down 50% since 1993. Most Americans think it's going up. Both true simultaneously.\"}",
    "sub_headline": "US VIOLENT CRIME RATE vs PUBLIC PERCEPTION · 1990-PRESENT · BJS/FBI + GALLUP"
  },
  "chart": {
    "x_axis": "Years 1990 to 2024 with 8 tick marks",
    "left_y_axis": {
      "color": "blue",
      "label": "{argument name=\"left axis label\" default=\"VIOLENT CRIME RATE per 100,000 people\"}",
      "range": "200 to 800"
    },
    "right_y_axis": {
      "color": "red",
      "label": "{argument name=\"right axis label\" default=\"% OF AMERICANS WHO SAY 'CRIME IS UP FROM LAST YEAR'\"}",
      "range": "20% to 80%"
    },
    "data_series": [
      {
        "name": "Reality",
        "style": "solid blue line",
        "trend": "peaks early then drops significantly",
        "annotations": [
          "1993 PEAK 747 violent crimes per 100,000 (with blue dot)",
          "REALITY: Crime Has Fallen (with blue arrow pointing to line)",
          "2024 376 per 100,000 ~50% LOWER than 1993 (with blue dot)"
        ]
      },
      {
        "name": "Public Perception",
        "style": "dashed red line",
        "trend": "remains relatively flat and high",
        "annotations": [
          "PUBLIC PERCEPTION: Remains High... (with red arrow pointing to line)",
          "2024 62% think crime is up (with red dot)"
        ]
      }
    ]
  },
  "callout_box": {
    "position": "bottom left inside chart area",
    "style": "light yellow rectangle",
    "icon": "lightbulb",
    "text": "{argument name=\"callout text\" default=\"The crime rate and the public's feeling about crime have almost no relationship.\"}"
  },
  "footer": {
    "text": "SOURCE: {argument name=\"footer source\" default=\"Bureau of Justice Statistics NCVS · FBI Uniform Crime Reports · Gallup Crime Poll\"}"
  }
}Reference images included
Editorial Dual-Axis Data Infographic needs input media to work. They load alongside the prompt when you open it in the studio.
How to use Editorial Dual-Axis Data Infographic in 3 steps
- 1Upload ImagePNG, JPG or paste
Add your photo
Upload the photo the template builds on. The prompt, model and format are already set.
- 2…a portrait of your subject in softgolden-hour light, 85mm…
Personalize
Edit the subject and creative details for your destination.
- 3Generate
Generate
Press Generate — your image is created in PicX Studio, so you can compare it with the original and refine one variable at a time.
More like this
Templates with the same subject, style or setup. Open one to see its prompt.
Editorial Dual-Axis Line Chart

Dual Editorial Poster Layout

Japan Travel Brochure Poster

Urban Fashion Editorial Collage Streetwear Poster
Monochrome Hypebeast Street Fashion Editorial Motion

Elegant Green Evening Gown Studio Fashion Portrait

Artistic Patchwork Fashion Portrait Spring Festival

Japanese Architectural Concrete Studio Fashion Campaign

Monroe and Ash Mediterranean Luxury Fashion Campaign

Premium Fashion Editorial Cover Layout System

Korean Luxury Fashion Editorial 2x2 Grid Series

High-Fashion Editorial Magazine Cover ICON
Make it yours
Editorial Dual-Axis Data Infographic works as-is. These are the safest ways to change it without losing the look.
Change one field
Copy a single group, rewrite it, and generate again so you can see what that field is doing.
Keep the frame, change the subject
Hold the composition and light of Editorial Dual-Axis Data Infographic, then swap wardrobe, props or the person for a new take.
| If the result… | Why | Fix |
|---|---|---|
| The result drifts from the preview | Too many fields changed at once. | Reuse Editorial Dual-Axis Data Infographic as-is first, then change one group — subject, light, or setting. |
| GPT Image 2 ignores part of the JSON | Some models flatten or skip nested keys. | Keep the same values and paste them as a short paragraph instead. |
More GPT Image 2 templates
Other prompts made for GPT Image 2.

Six VTuber Japanese Logo Sheet

Realistic Portrait of Woman and Deer

The Vista Modular Condo Poster

AI Model Routing Comparison Infographic

2.5D Anime Art Board

Isometric Productivity Desk Scene

New York Double Exposure Poster

Four-Panel AI Landscape Comparison

Japanese Tatami Lifestyle Magazine Cover

NESCAFÉ Coffee Map Poster
More image prompts
Fresh picks from across the catalog.

Cinematic Urban Male Portrait with Identity Preservation
Commercial Beauty Product Photograph

Google Maps to Illustration Transformation

Ultra-Realistic Glamour Polaroid Prompt

Melancholic Marionette Watercolor

Japanese Journal Style Cat Diary

Urban Photographer Lifestyle Portrait

Classical Chinese poem illustration with text

Glamorous Photo Prompt for Gemini Nano Banana Creation
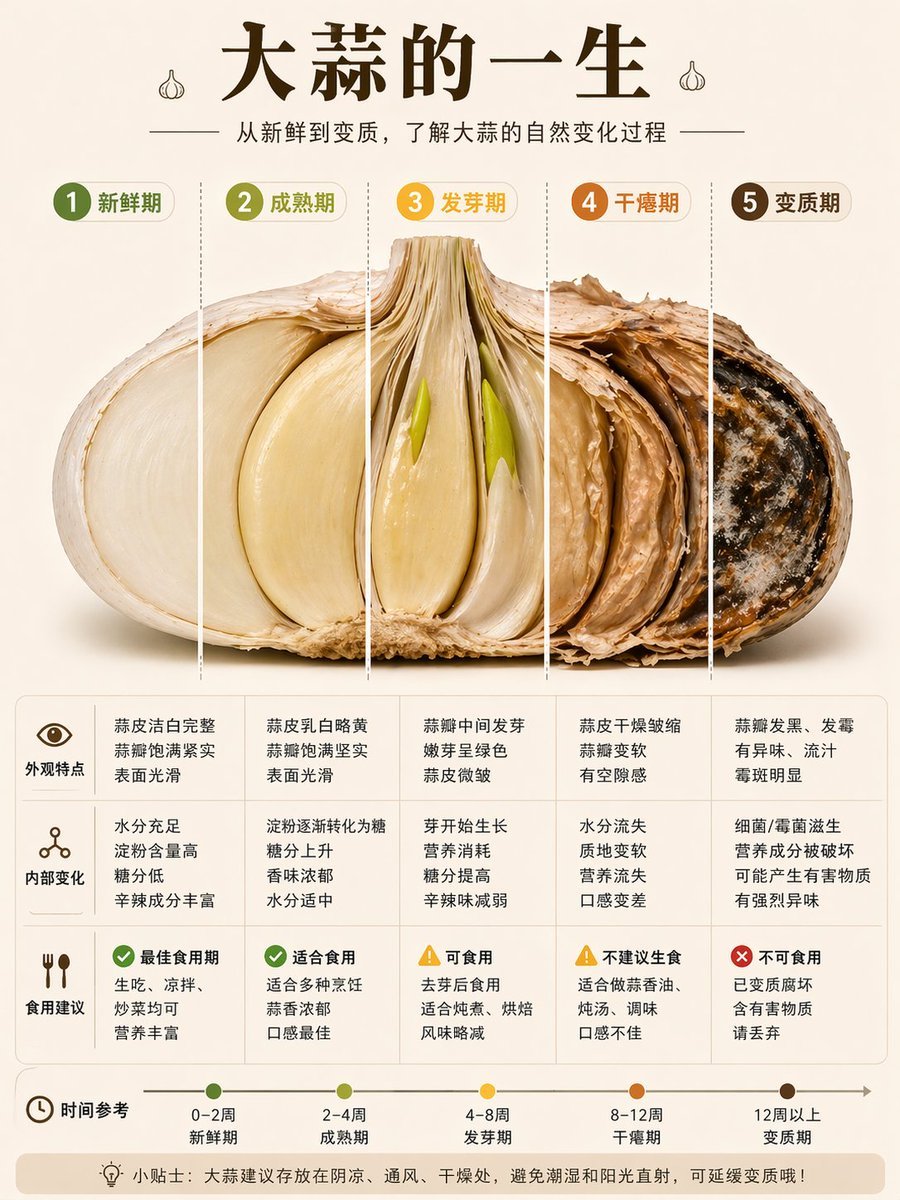
Garlic Life Cycle Infographic
Browse template categories
Editorial Dual-Axis Data Infographic questions
How do I use the Editorial Dual-Axis Data Infographic template?
Add your photo if the template asks for one, edit the prompt if you like — the template's model and format are already selected — and press Generate. Your version opens in PicX Studio.
Can I customize the Editorial Dual-Axis Data Infographic template?
Yes. You can change the subject, setting, lighting, mood, format, and available model controls before creating your image.
Is the Editorial Dual-Axis Data Infographic template free?
Opening and editing this template is free. Generating uses credits, shown on the Generate button when you are signed in.
Which AI model should I use?
Start with GPT Image 2, which is the model associated with this template. You can compare another compatible model for a different finish.
Looking for something else? Browse all templates.

Your photo, any look
Thousands of ready templates for every top image and video model, from one credit balance.